Viewing App Logs in Elastic Kibana Dashboard
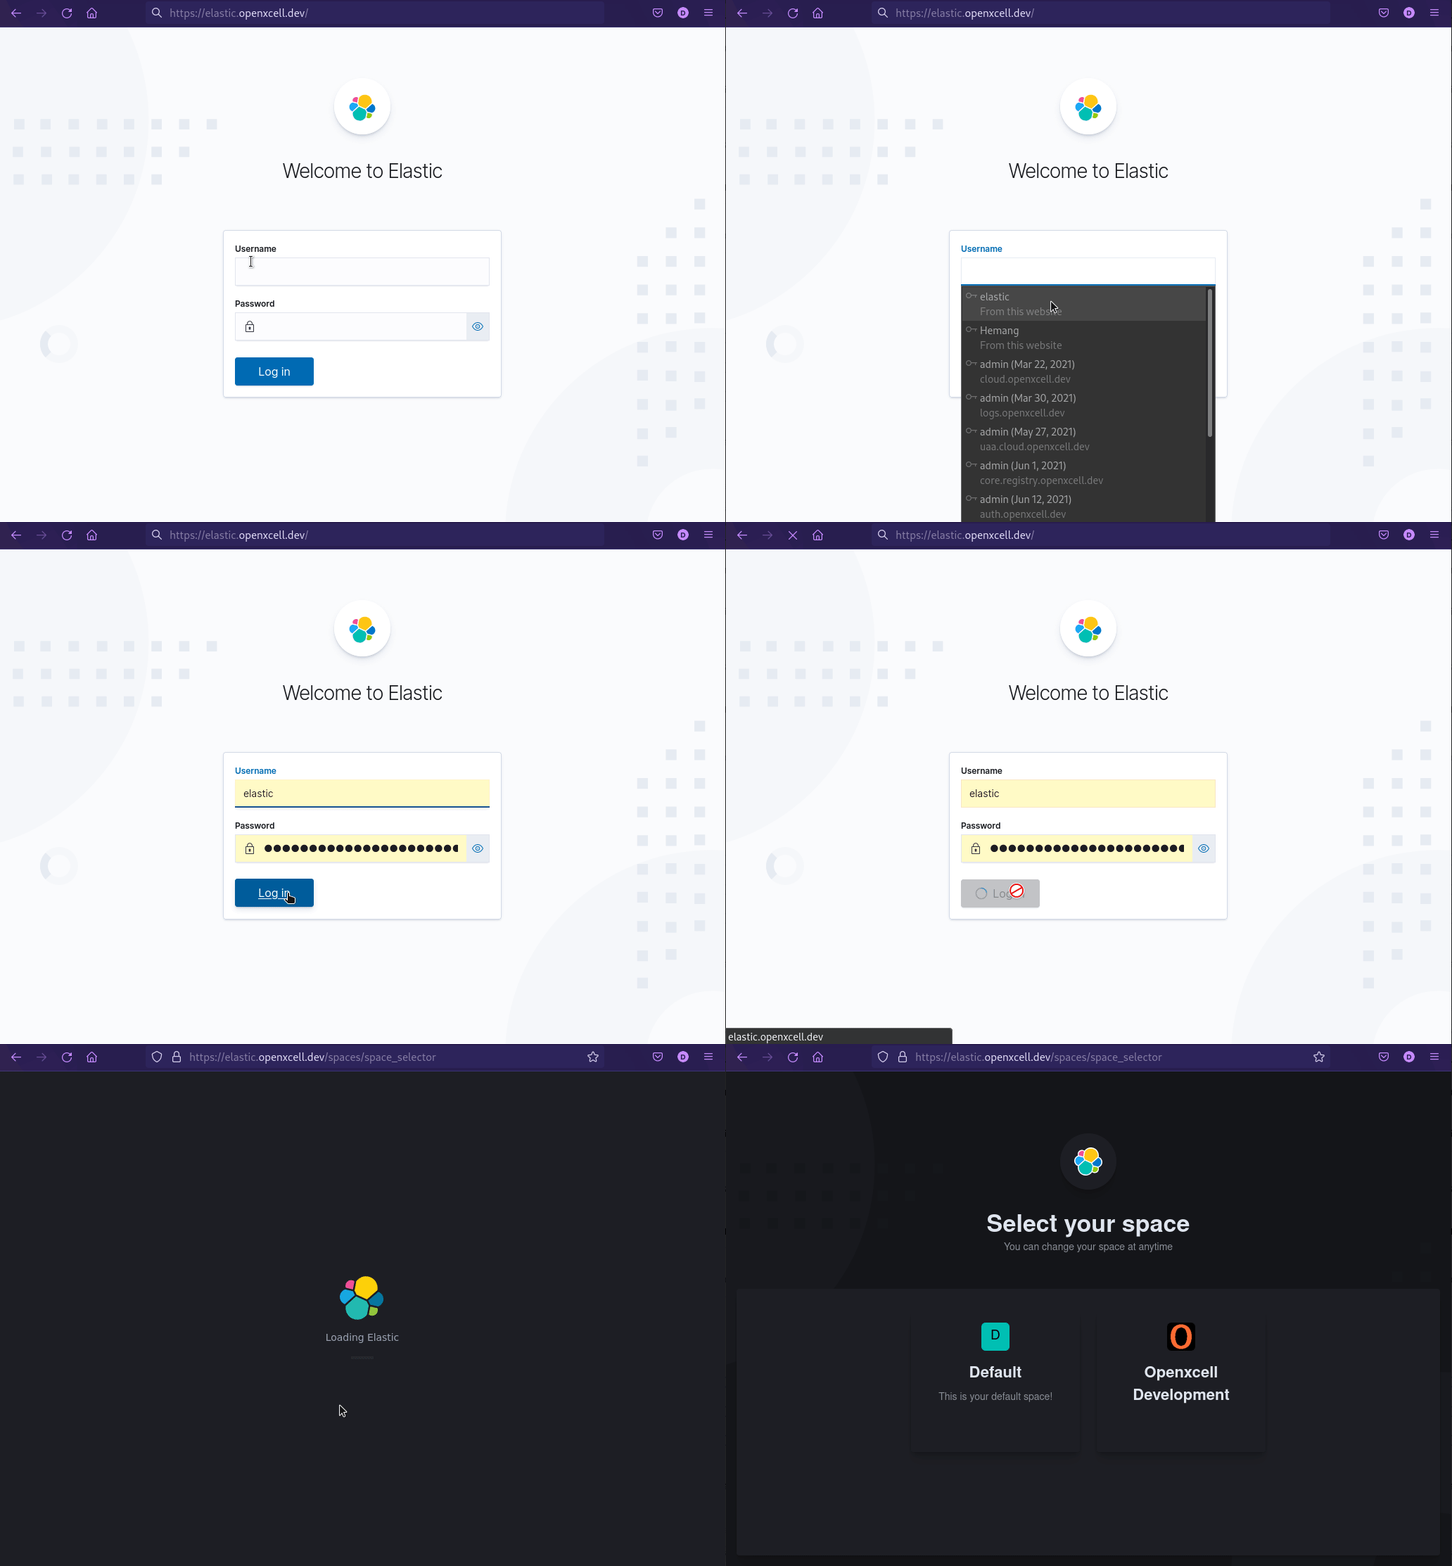
- Login to Kibana Dashboard at https://elastic.openxcell.dev
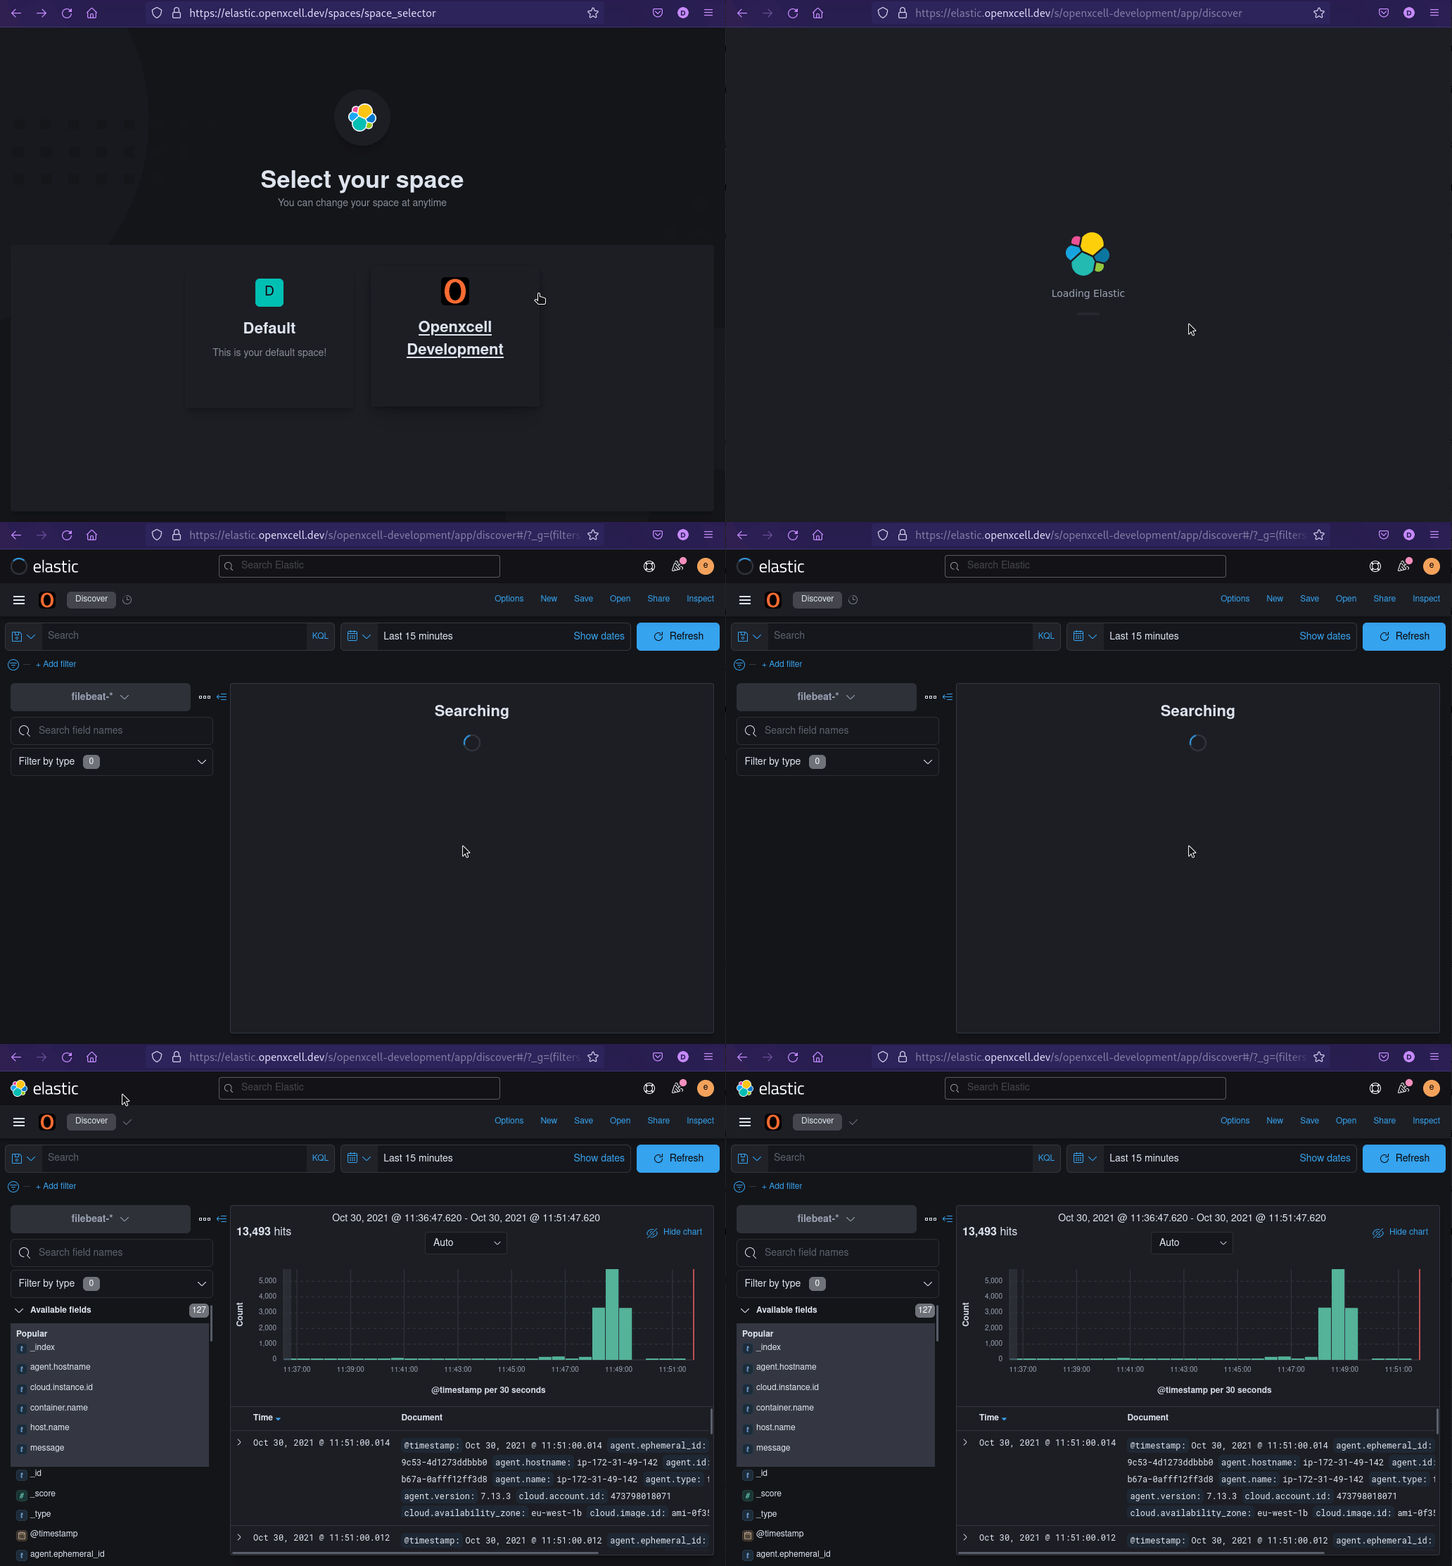
- Choose Openxcell Development Space:
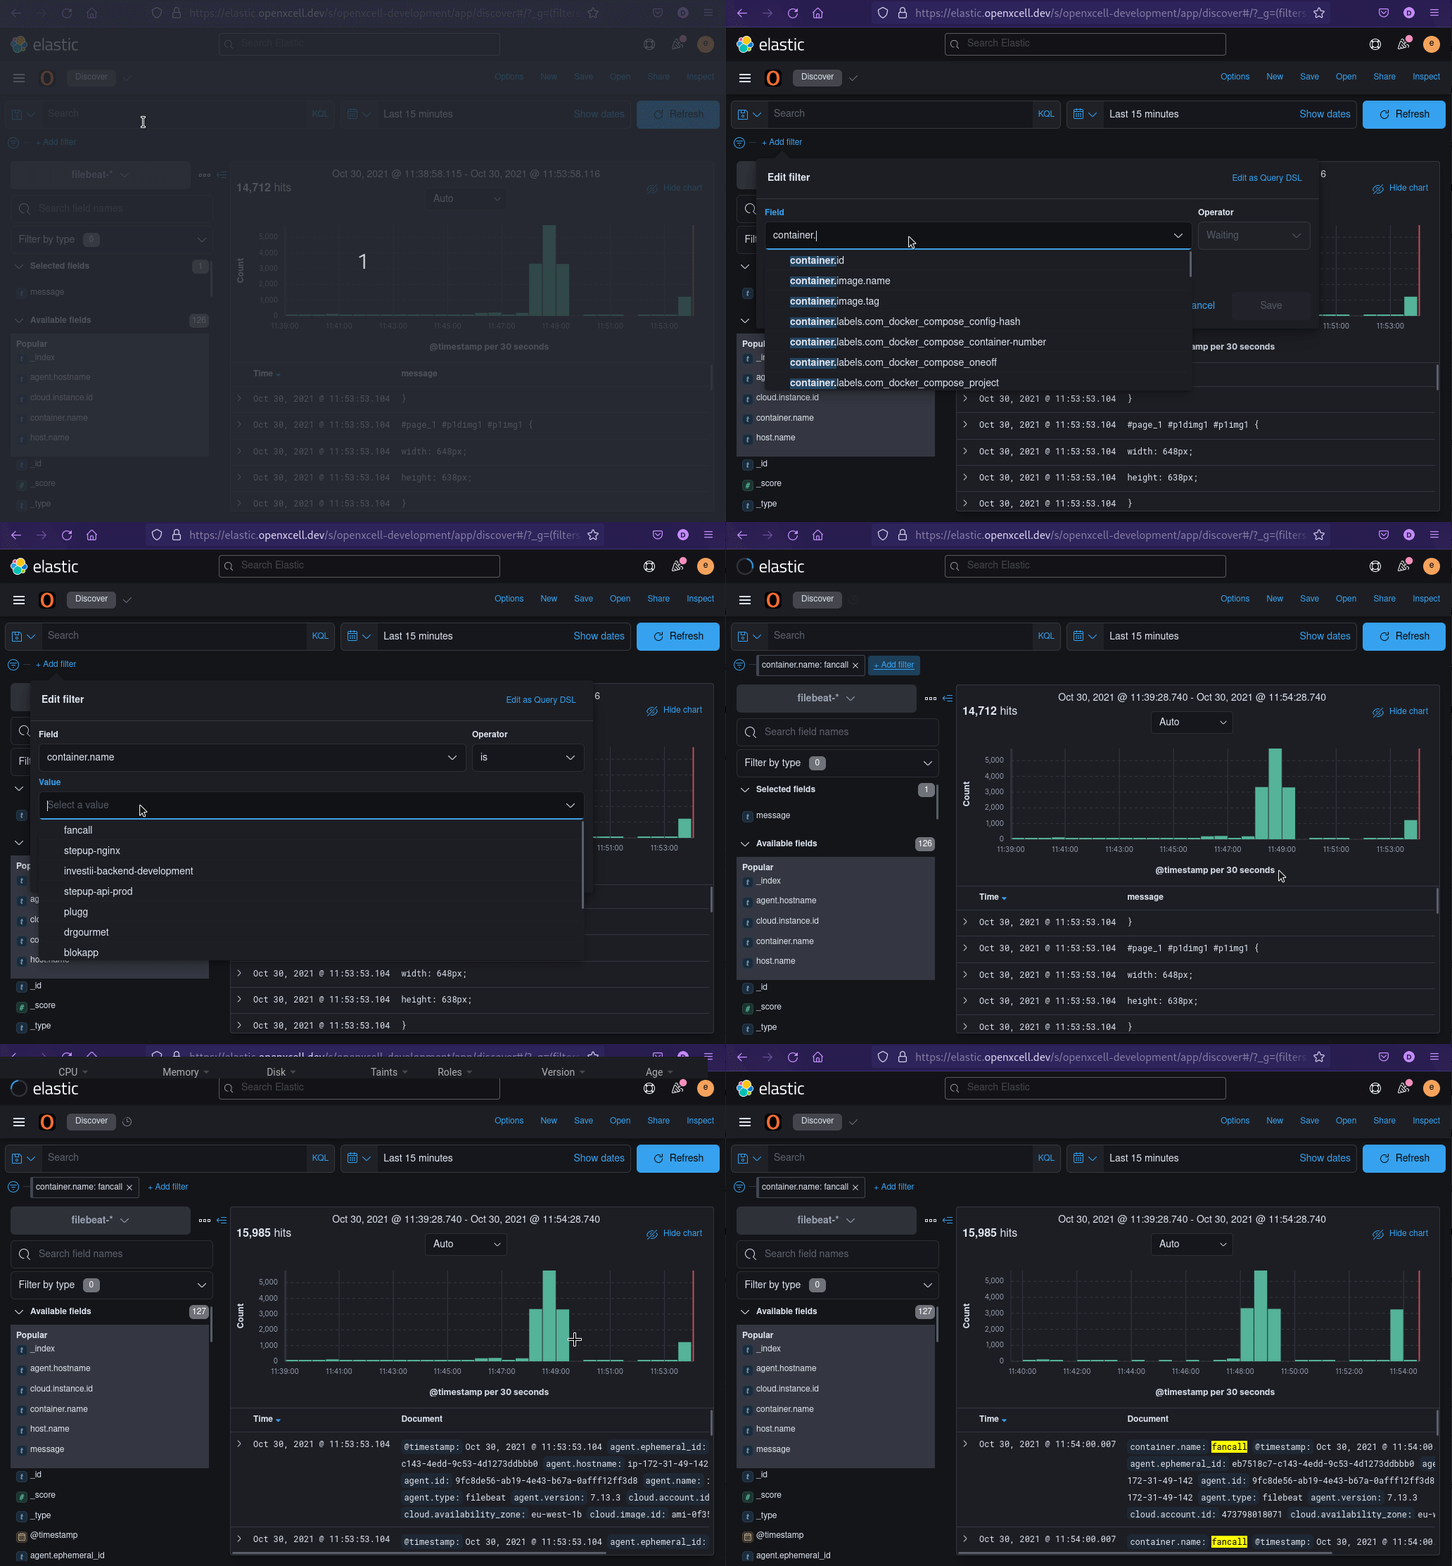
- Add Container name filter to filter your application logs
- Filter Message Field only:
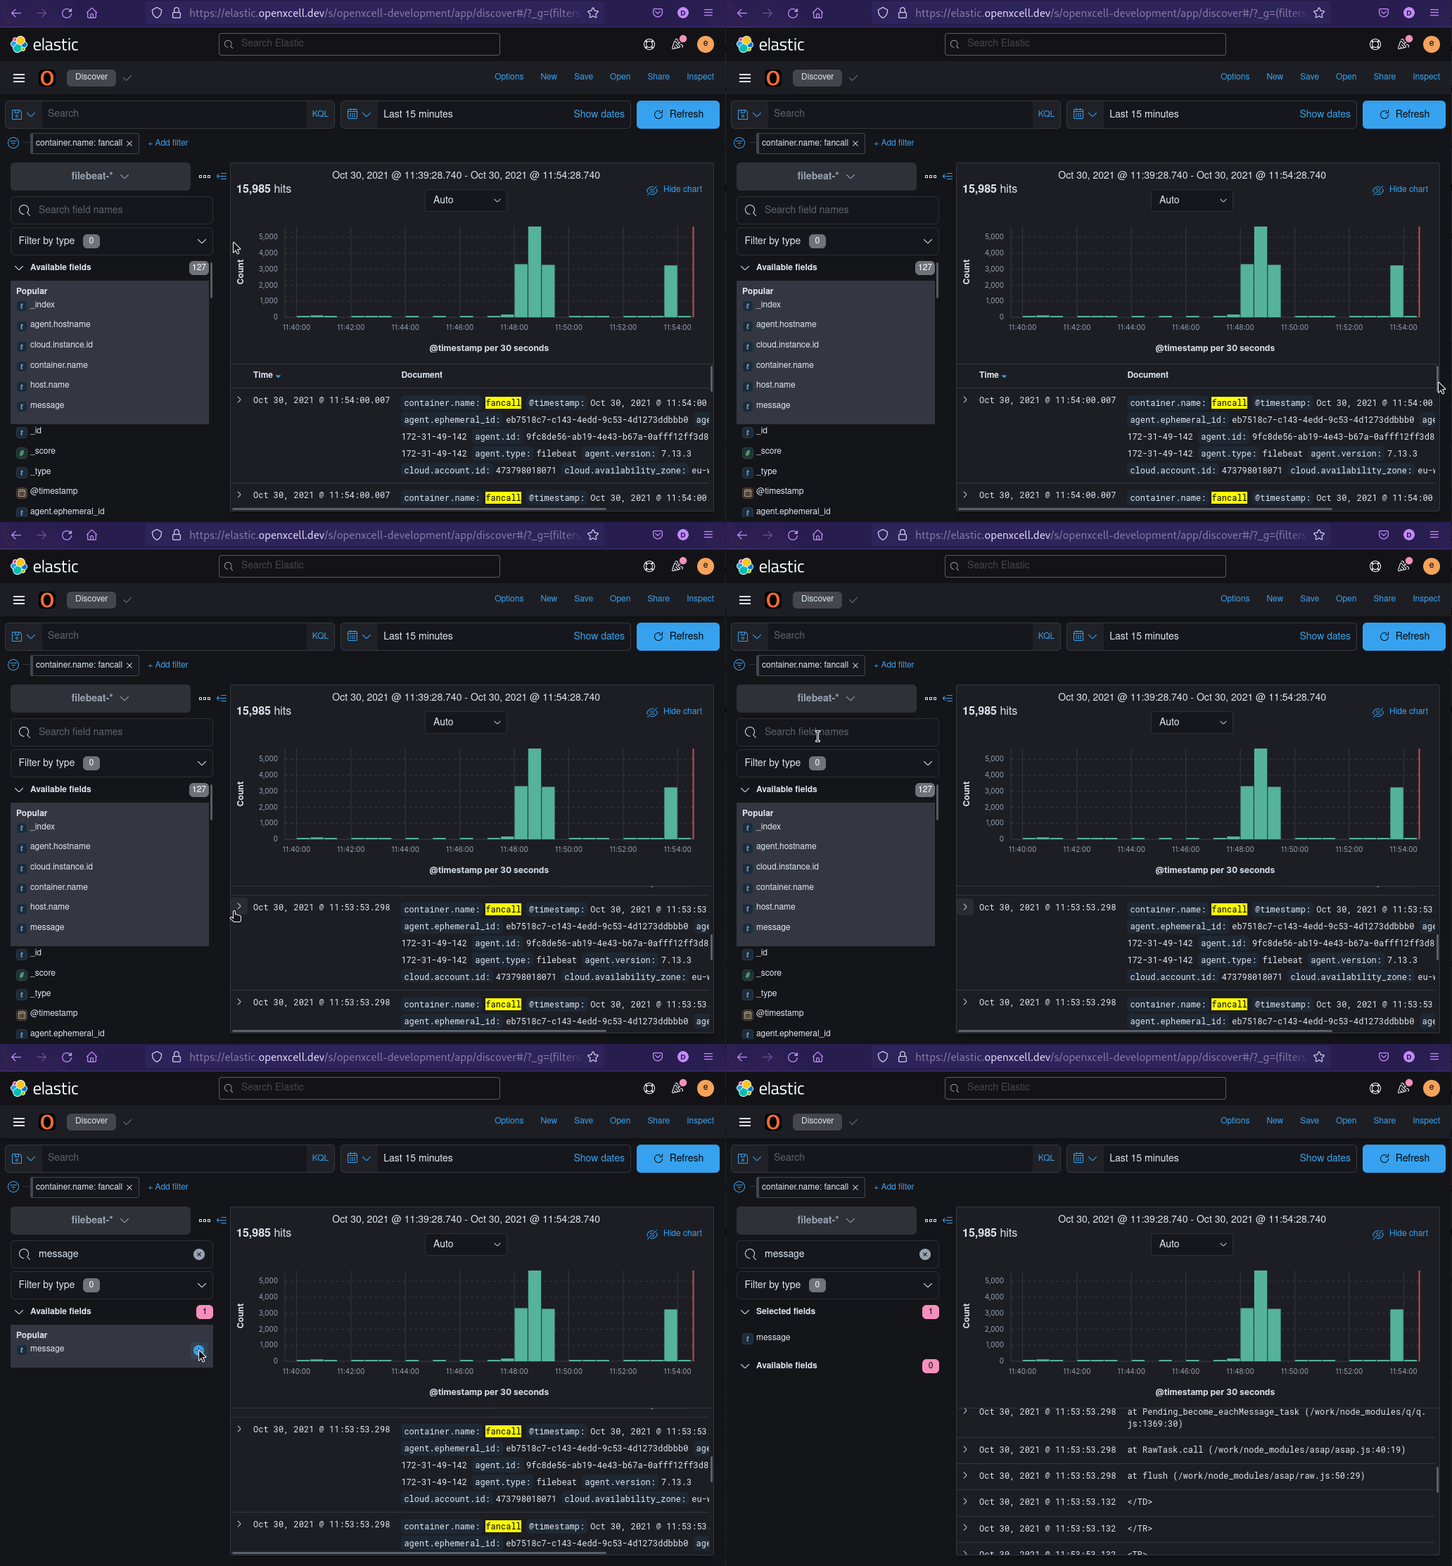
- Select Time Range:
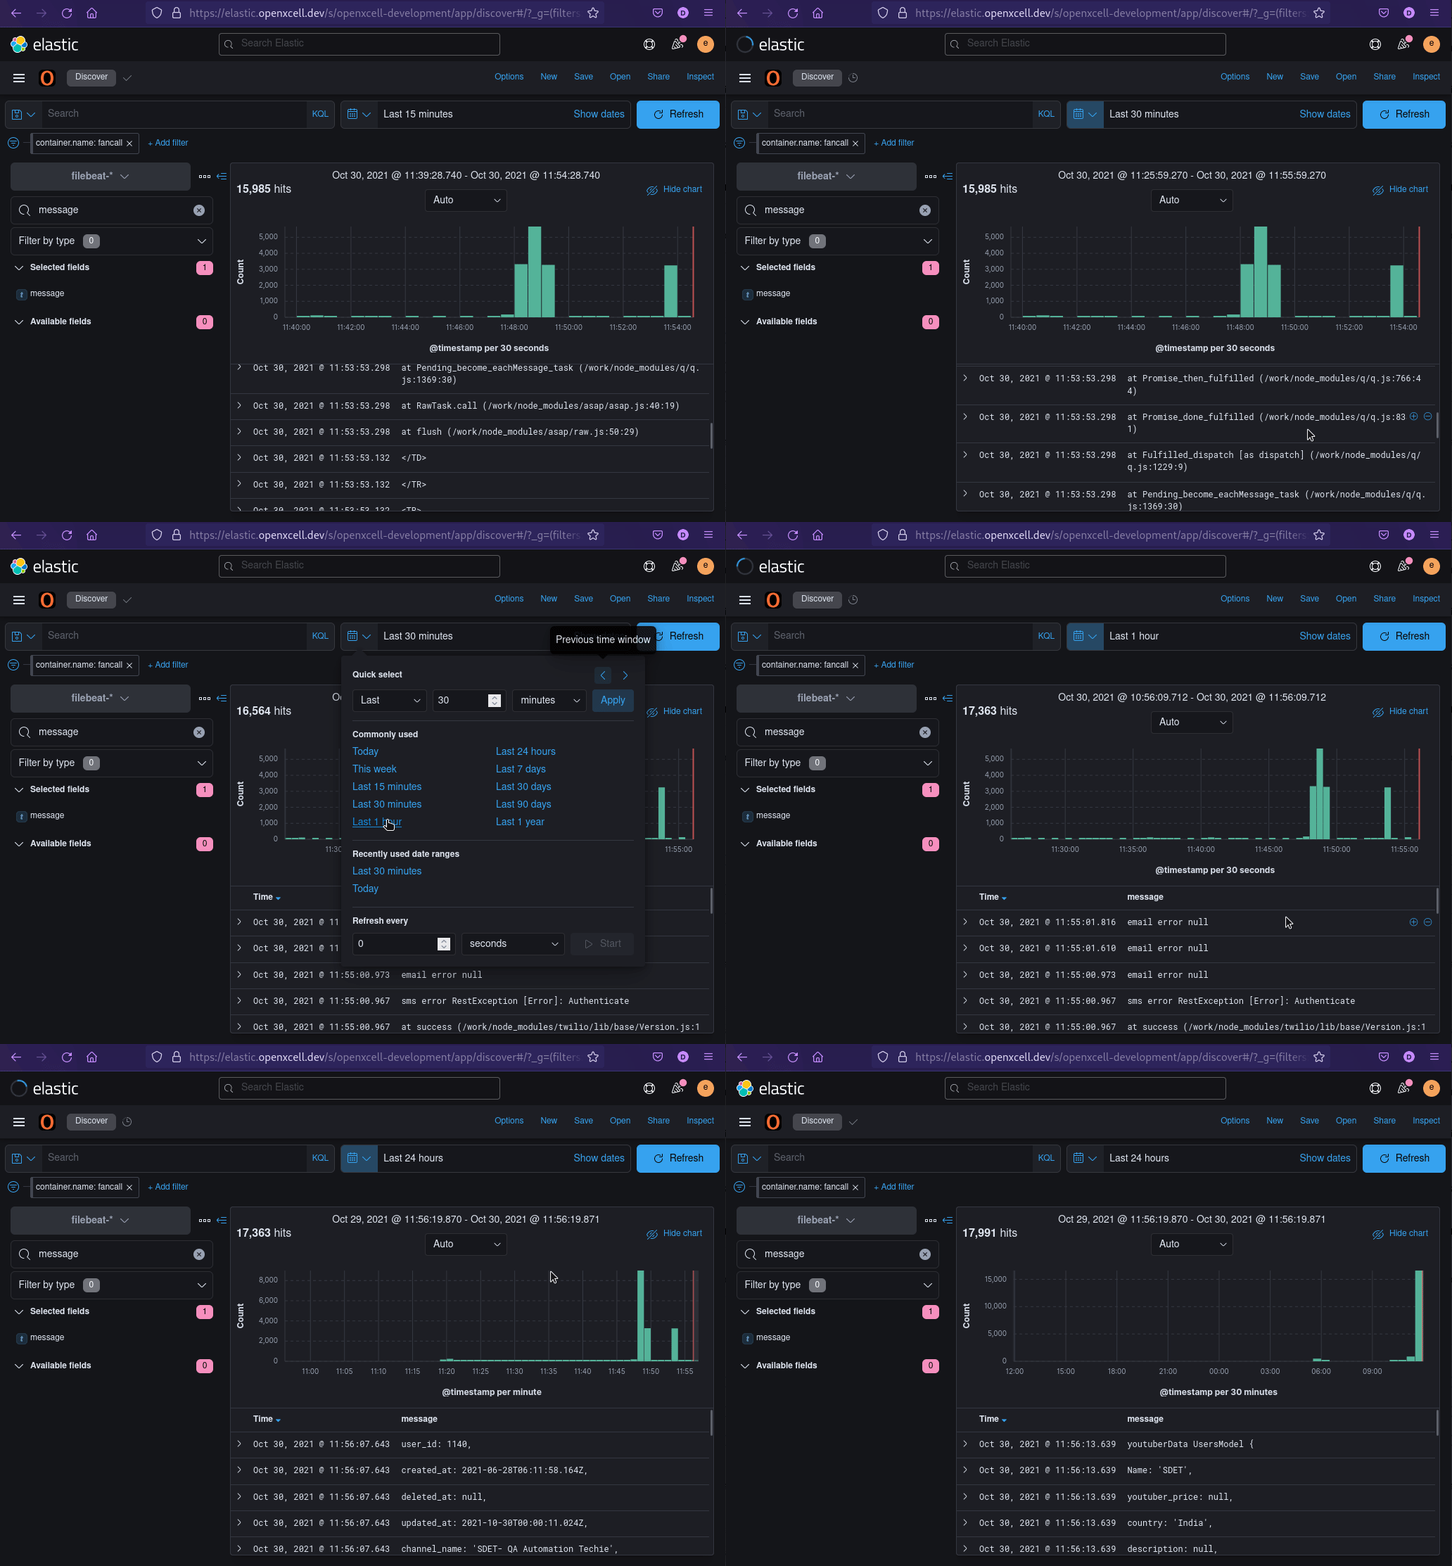
- Choose Openxcell Development Space:
- Add Container name filter to filter your application logs
- Filter Message Field only:
- Select Time Range:
Related Articles
view logs in grafana openxcell
Hello Here, I'll outline every step for viewing the API-Development server's logs. technology is used, such as Java, Node.js, and Next.js. Step 1 : Login GRAFANA : https://grafana.openxcell.dev/login Note : Login with openxcell SSO Step 2 : Go to ...What & How : CI/CD Tools 2 (Kibana)
Now you can see logs in Kibana(Elastic Search) your log files will be transferred here so you can easily have a look at erros without logging in SSH/putty. here's the link : oxkibana.orderhive.plus How to use kibana: 1. Go to the link: This is main ...What & How : CI/CD Tools
After your project has been successfully automated... 1. Jenkins - You will be provided with a Jenkins URL: jenkins.openxcell.info:8080 - You need to login to this. - You will be given credentials by DevOps Team - If you didn't get your ...Define base path and public URL by Sagar Prajapati
When you deploy React.js app apart from root path, there are two things needs to configured. As by default React.js will try to load from root of domain. Considering you are deploying on : https://jenkins.openxcell.info/my-app/website/ Your root path ...What & How : Docker commands
1. Install Docker $curl https://get.docker.com/ > dockerinstall && chmod 777 dockerinstall && ./dockerinstall 2. Docker should now be installed, the daemon started, and the process enabled to start on boot. Check that it's running: $service docker ...