view logs in grafana openxcell
Hello
Here, I'll outline every step for viewing the API-Development server's logs. technology is used, such as Java, Node.js, and Next.js.
Step 1 : Login GRAFANA : https://grafana.openxcell.dev/login
Here, I'll outline every step for viewing the API-Development server's logs. technology is used, such as Java, Node.js, and Next.js.
Step 1 : Login GRAFANA : https://grafana.openxcell.dev/login

Note : Login with openxcell SSO
Step 2 : Go to Search Dashboard :
Step 3 : Search dashboard name : kubernetes logs
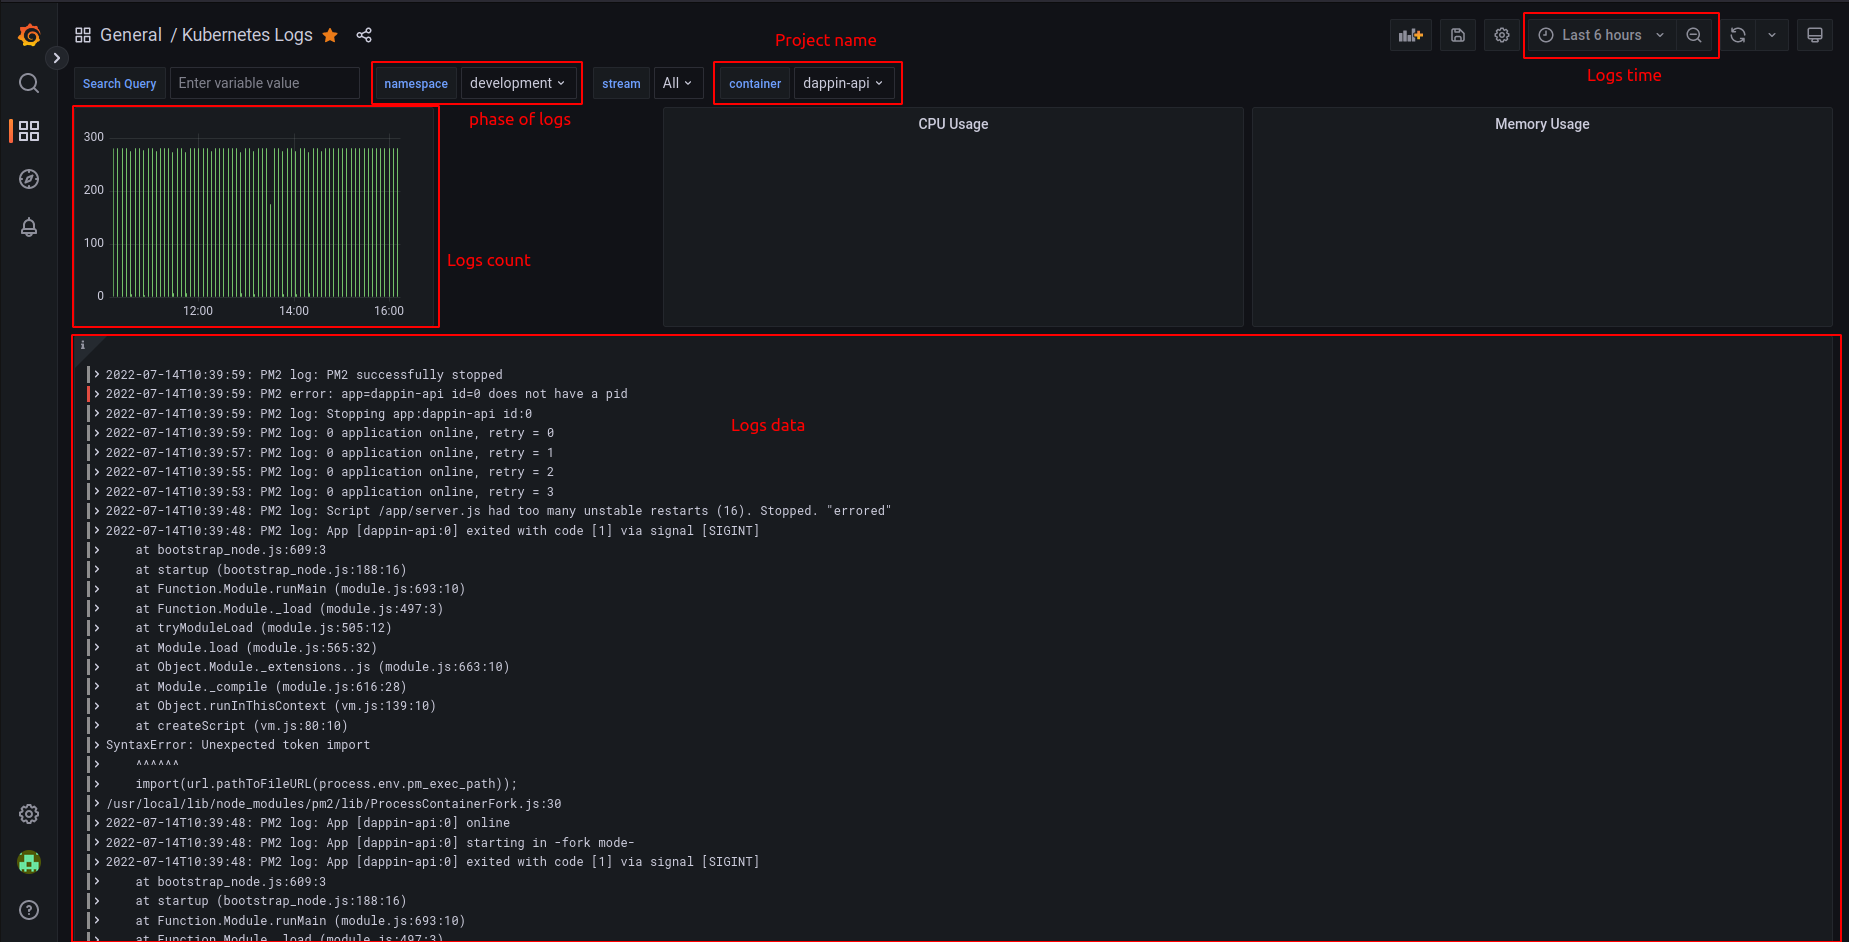
Step 4 : dashboard view.
- set namespace - development
- container - project name
- set time line for logs starting time to till now
- set namespace - development
- container - project name
- set time line for logs starting time to till now
Related Articles
Viewing App Logs in Elastic Kibana Dashboard
- Login to Kibana Dashboard at https://elastic.openxcell.dev - Choose Openxcell Development Space: - Add Container name filter to filter your application logs - Filter Message Field only: - Select Time Range:Registering to OpenXcell SSO
Overview: Openxcell SSO, is an enterprise grade Identity Provider supporting Single-Sign-On Using various authentication protocols such as OIDC and SAML. To ensure single point of authentication and security across all the organization owned and ...HOW TO LOGIN OPENXCELL AWS ACCOUNT
Login steps for openxcell AWS. Step 1 : Raise ticket for AWS Access. ( mail address : devops@openxcell.info ) [ Ticket will required only for new access ] Hit this URL Step 2 : https://openxcelldev.awsapps.com/start#/ Step 3 : Enter login I'd / ...Connecting to development database
Overview: Database Admin UI URL PHPMyAdmin https://pma.openxcell.dev Adminer https://adminer.openxcell.dev MySQL Databases: For all the application using mysql database https://pma.openxcell.dev serves the PHPMyAdmin Frontend. To access the ...What & How : Docker commands
1. Install Docker $curl https://get.docker.com/ > dockerinstall && chmod 777 dockerinstall && ./dockerinstall 2. Docker should now be installed, the daemon started, and the process enabled to start on boot. Check that it's running: $service docker ...